📊 Monitoring
KORM provides comprehensive monitoring capabilities including distributed tracing and real-time logging.
Distributed Tracing
Track requests and database operations across your application:
korm.EnableTracing()Then in your handler
func BlogHandler(c *ksmux.Context) {
    sp, ctx := ksmux.StartSpan(c.Request.Context(), "BlogHandler")
    defer sp.End()
    sp.SetTag("authenticated", fmt.Sprint(c.IsAuthenticated()))
    sp.SetStatusCode(200)
    c.Html("portfolio/index.html", map[string]any{
        "posts": GetPosts(ctx),
    })
}

func GetPosts(parentCtx context.Context) []Post {
    sp, _ := ksmux.StartSpan(parentCtx, "GetPosts")
    defer sp.End()
    posts, _ := korm.Model[Post]().Trace().Where("public = ?", true).OrderBy("-created_at").All()
    sp.SetTag("posts_len", strconv.Itoa(len(posts)))
    return posts
}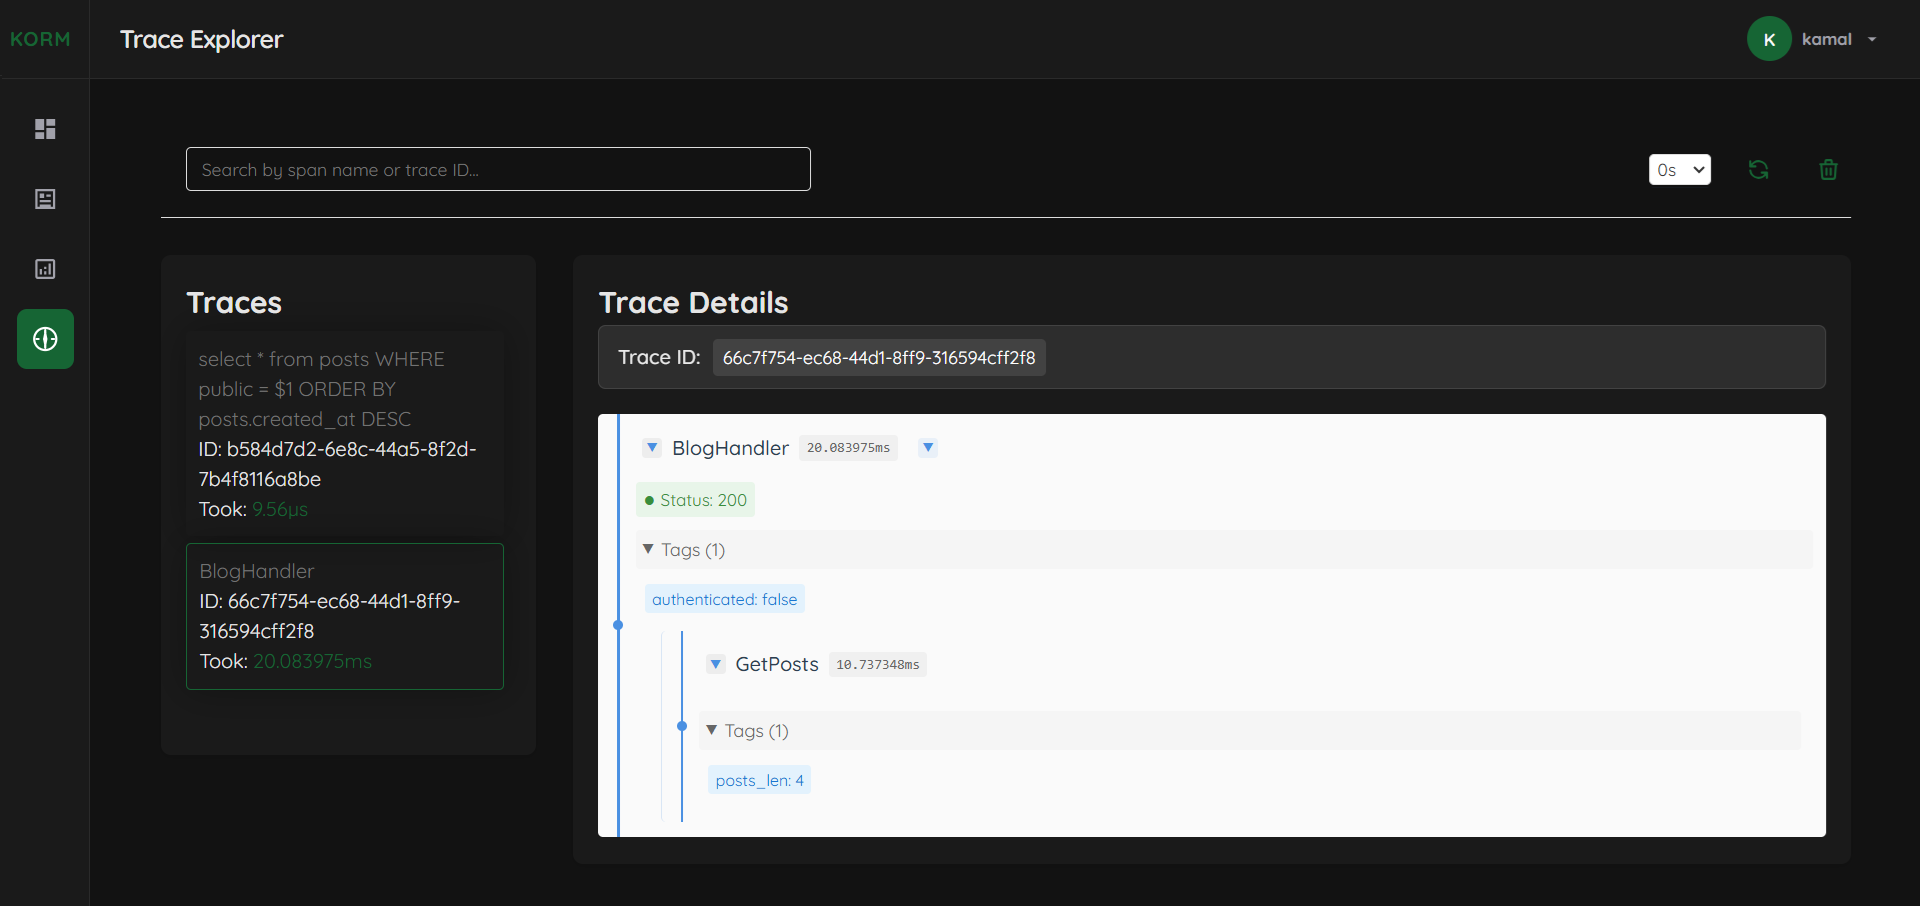
Trace explorer showing handler spans with parent-child relationship
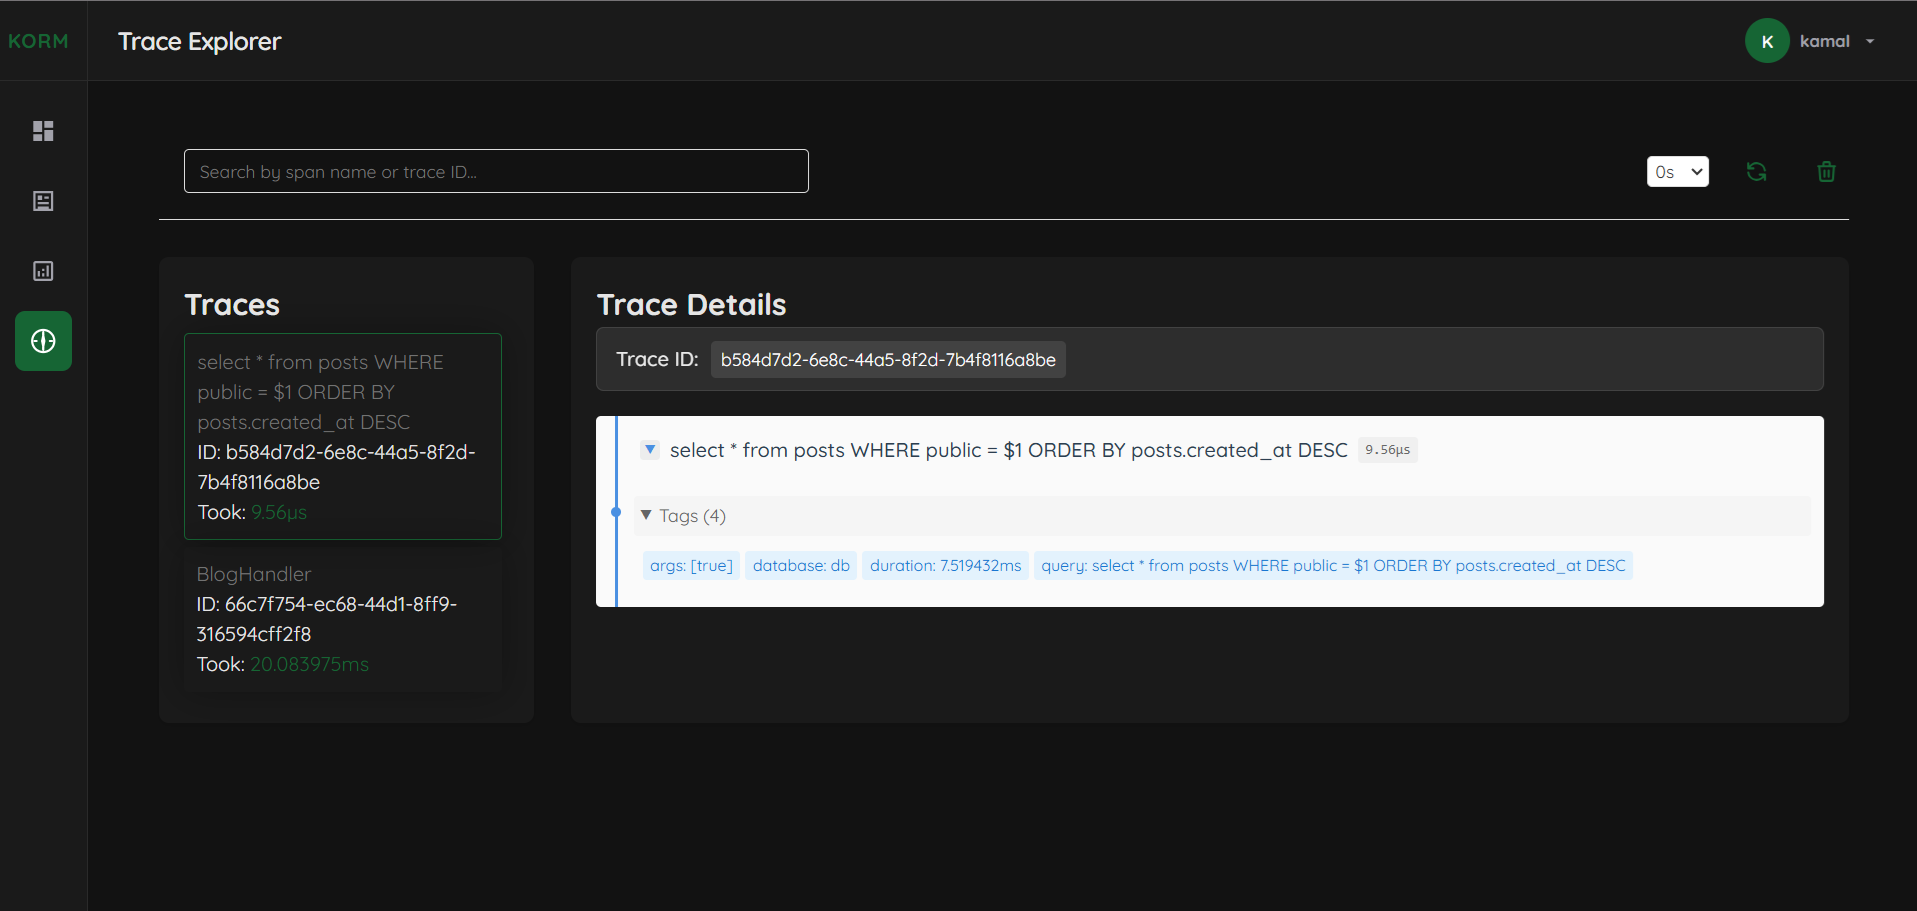
Detailed SQL query tracing with execution time and parameters
SQL Query Tracing
Enable tracing for any database operation:
// Using Model builders
users, _ := korm.Model[User]().Trace().Where("active = ?", true).All()

// Using To selector
var data []map[string]any
err := korm.To(&data).Trace().Query("SELECT * FROM users")
Export Configuration
Configure trace export to your preferred backend:
// Configure export with endpoint and type
ksmux.ConfigureExport("http://localhost:14268/api/traces", ksmux.ExportTypeJaeger)

// Available export types:
ksmux.ExportTypeJaeger    // Default: http://localhost:14268/api/traces
ksmux.ExportTypeTempo     // Default: http://localhost:9411/api/v2/spans
ksmux.ExportTypeZipkin    // Default: http://localhost:9411/api/v2/spans
ksmux.ExportTypeDatadog   // Default: https://trace.agent.datadoghq.com
ksmux.ExportTypeNewRelic  // Default: https://trace-api.newrelic.com/trace/v1
ksmux.ExportTypeHoneycomb // Default: https://api.honeycomb.io/1/traces
ksmux.ExportTypeOTLP      // Default: http://localhost:4318/v1/traces
ksmux.ExportTypeSignoz    // Default: http://localhost:4318/v1/traces
Real-time Logging
Built-in logging system with dashboard integration:
// Basic error logging
lg.Error("missing name in body")  // Shows in console and dashboard

// Error with caller information
lg.ErrorC("missing name in body") // Shows filename and line number

// Different log levels available
lg.Info("server started on :9313")
lg.Debug("processing request")
lg.Warn("high memory usage")
lg.Success("database connected")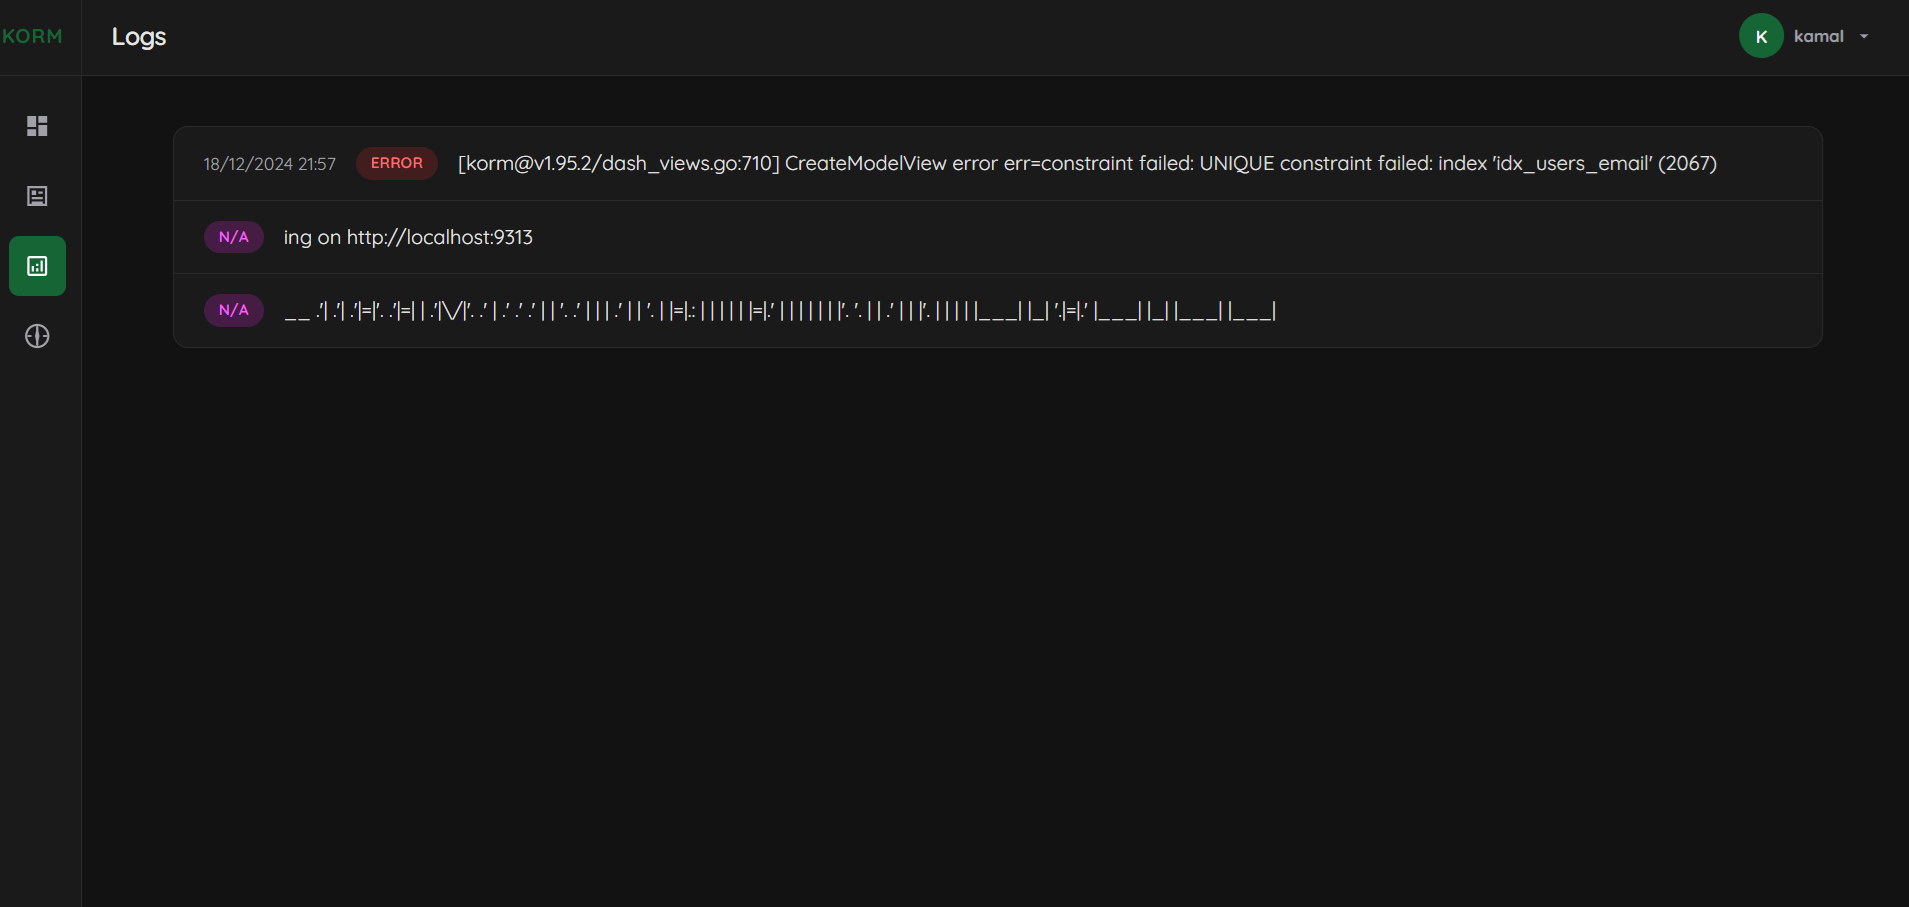
Real-time log viewer with error highlighting and timestamp information
Monitoring Features
- Distributed Tracing
- Parent-child span relationships
- Context propagation across functions
- SQL query performance tracking
- Multiple export backends support
- Custom tag support for spans
- Real-time Logging
- Multiple log levels (ERROR, INFO, DEBUG, etc.)
- Source code location tracking
- Timestamp for each entry
- Dashboard integration
- Console synchronization